install.packages("sdstudio")sdstudio package
sdstudio is a companion R package with surveydown. It has a single function: sdstudio::launch(), which launches the Surveydown Studio - a locally run shiny app that supports a graphic interface for editing, previewing, and monitoring a survey.
Tip
For a full introduction to the surveydown studio, proceed to our blog post Introducing sdstudio: A companion GUI for surveydown.
Installation
You can install sdstudio from CRAN in your R console:
or you can install the development version from GitHub:
# install.packages("pak")
pak::pak("surveydown-dev/sdstudio", ask = FALSE)
Running the studio
Once installed, run this to launch the studio:
sdstudio::launch()
Monitoring Survey Responses
After launching the studio, navigate to the Responses tab to access the local dashboard.
The Responses tab in the surveydown studio allows you to view your survey data in a user-friendly interface. It contains survey answering statistics and response summarization charts. On the lower part you can preview the survey data sheet. There is a download button for you to obtain the survey data in CSV format.
On the top right corner, you can toggle between Local and DB mode. The Local mode grabs the data from your preview_data.csv file, which is an auto-generated file when you don’t connect to a database. The DB mode grabs the data from your connected database.
Local Mode
This is the Local mode dashboard:
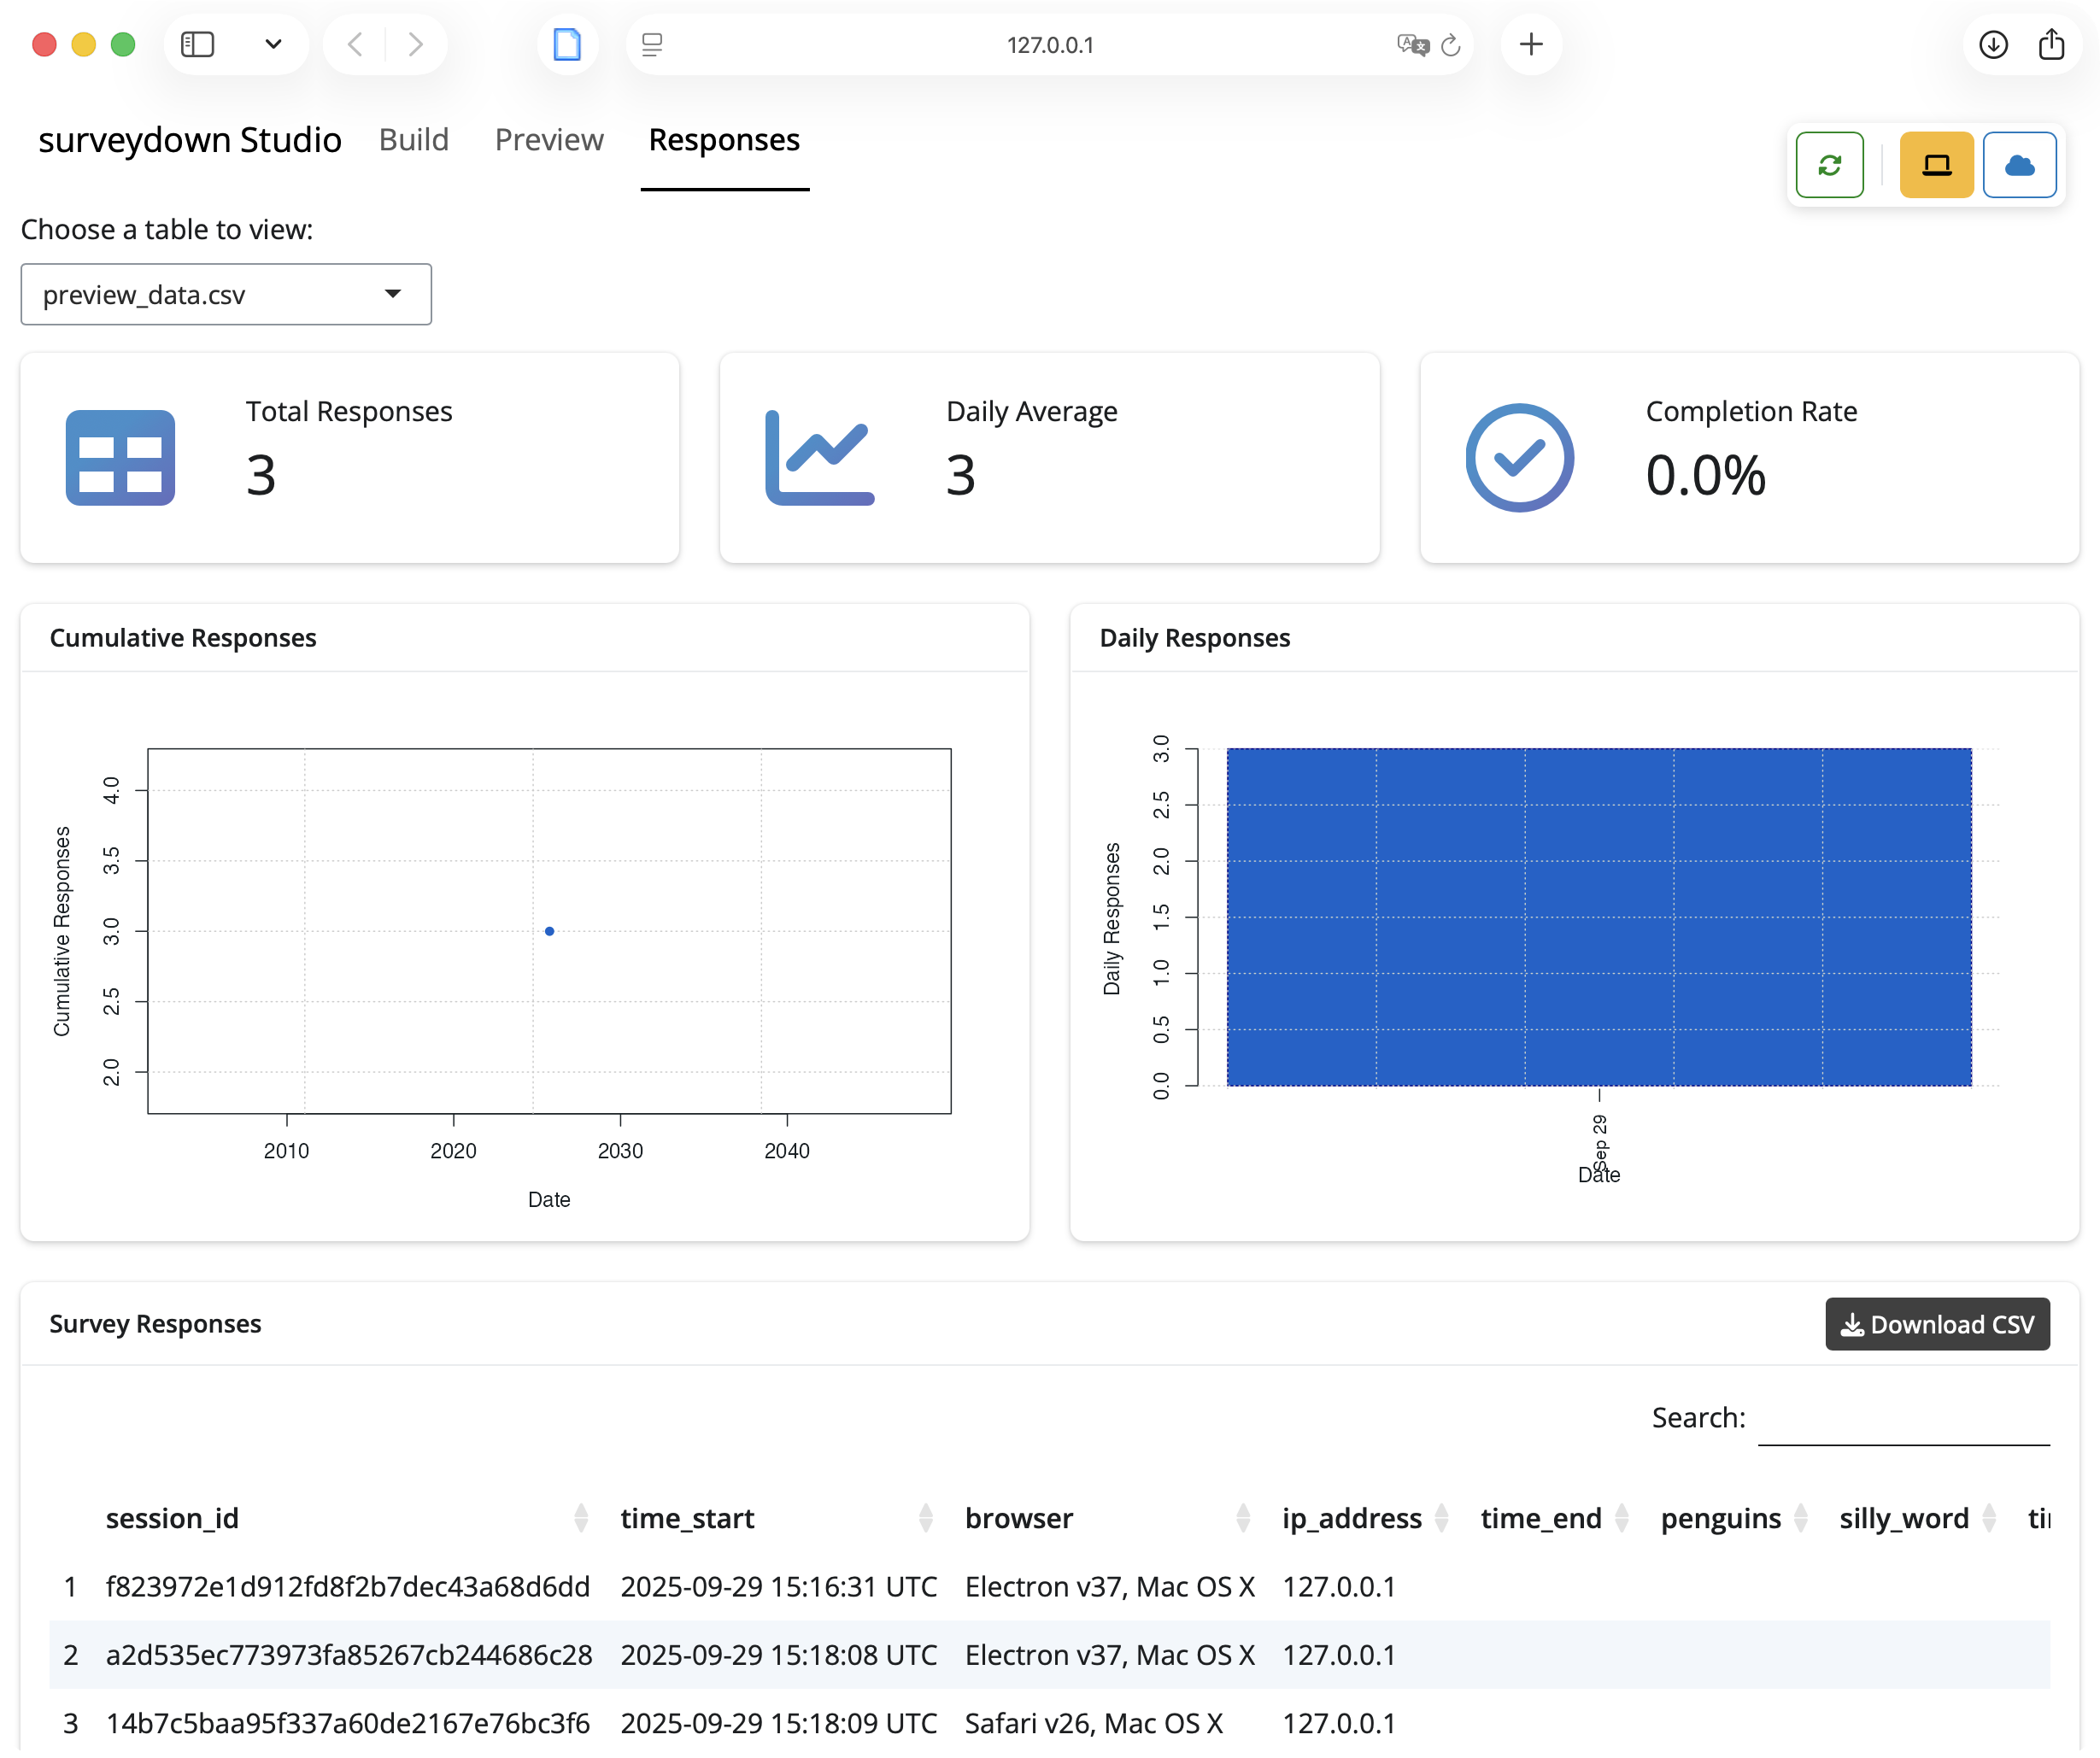
In this mode, the preview_data.csv file is auto-selected. The attributes of this data file are displayed in different cards, followed by the actual data sheet preview in the “Survey Responses” card.
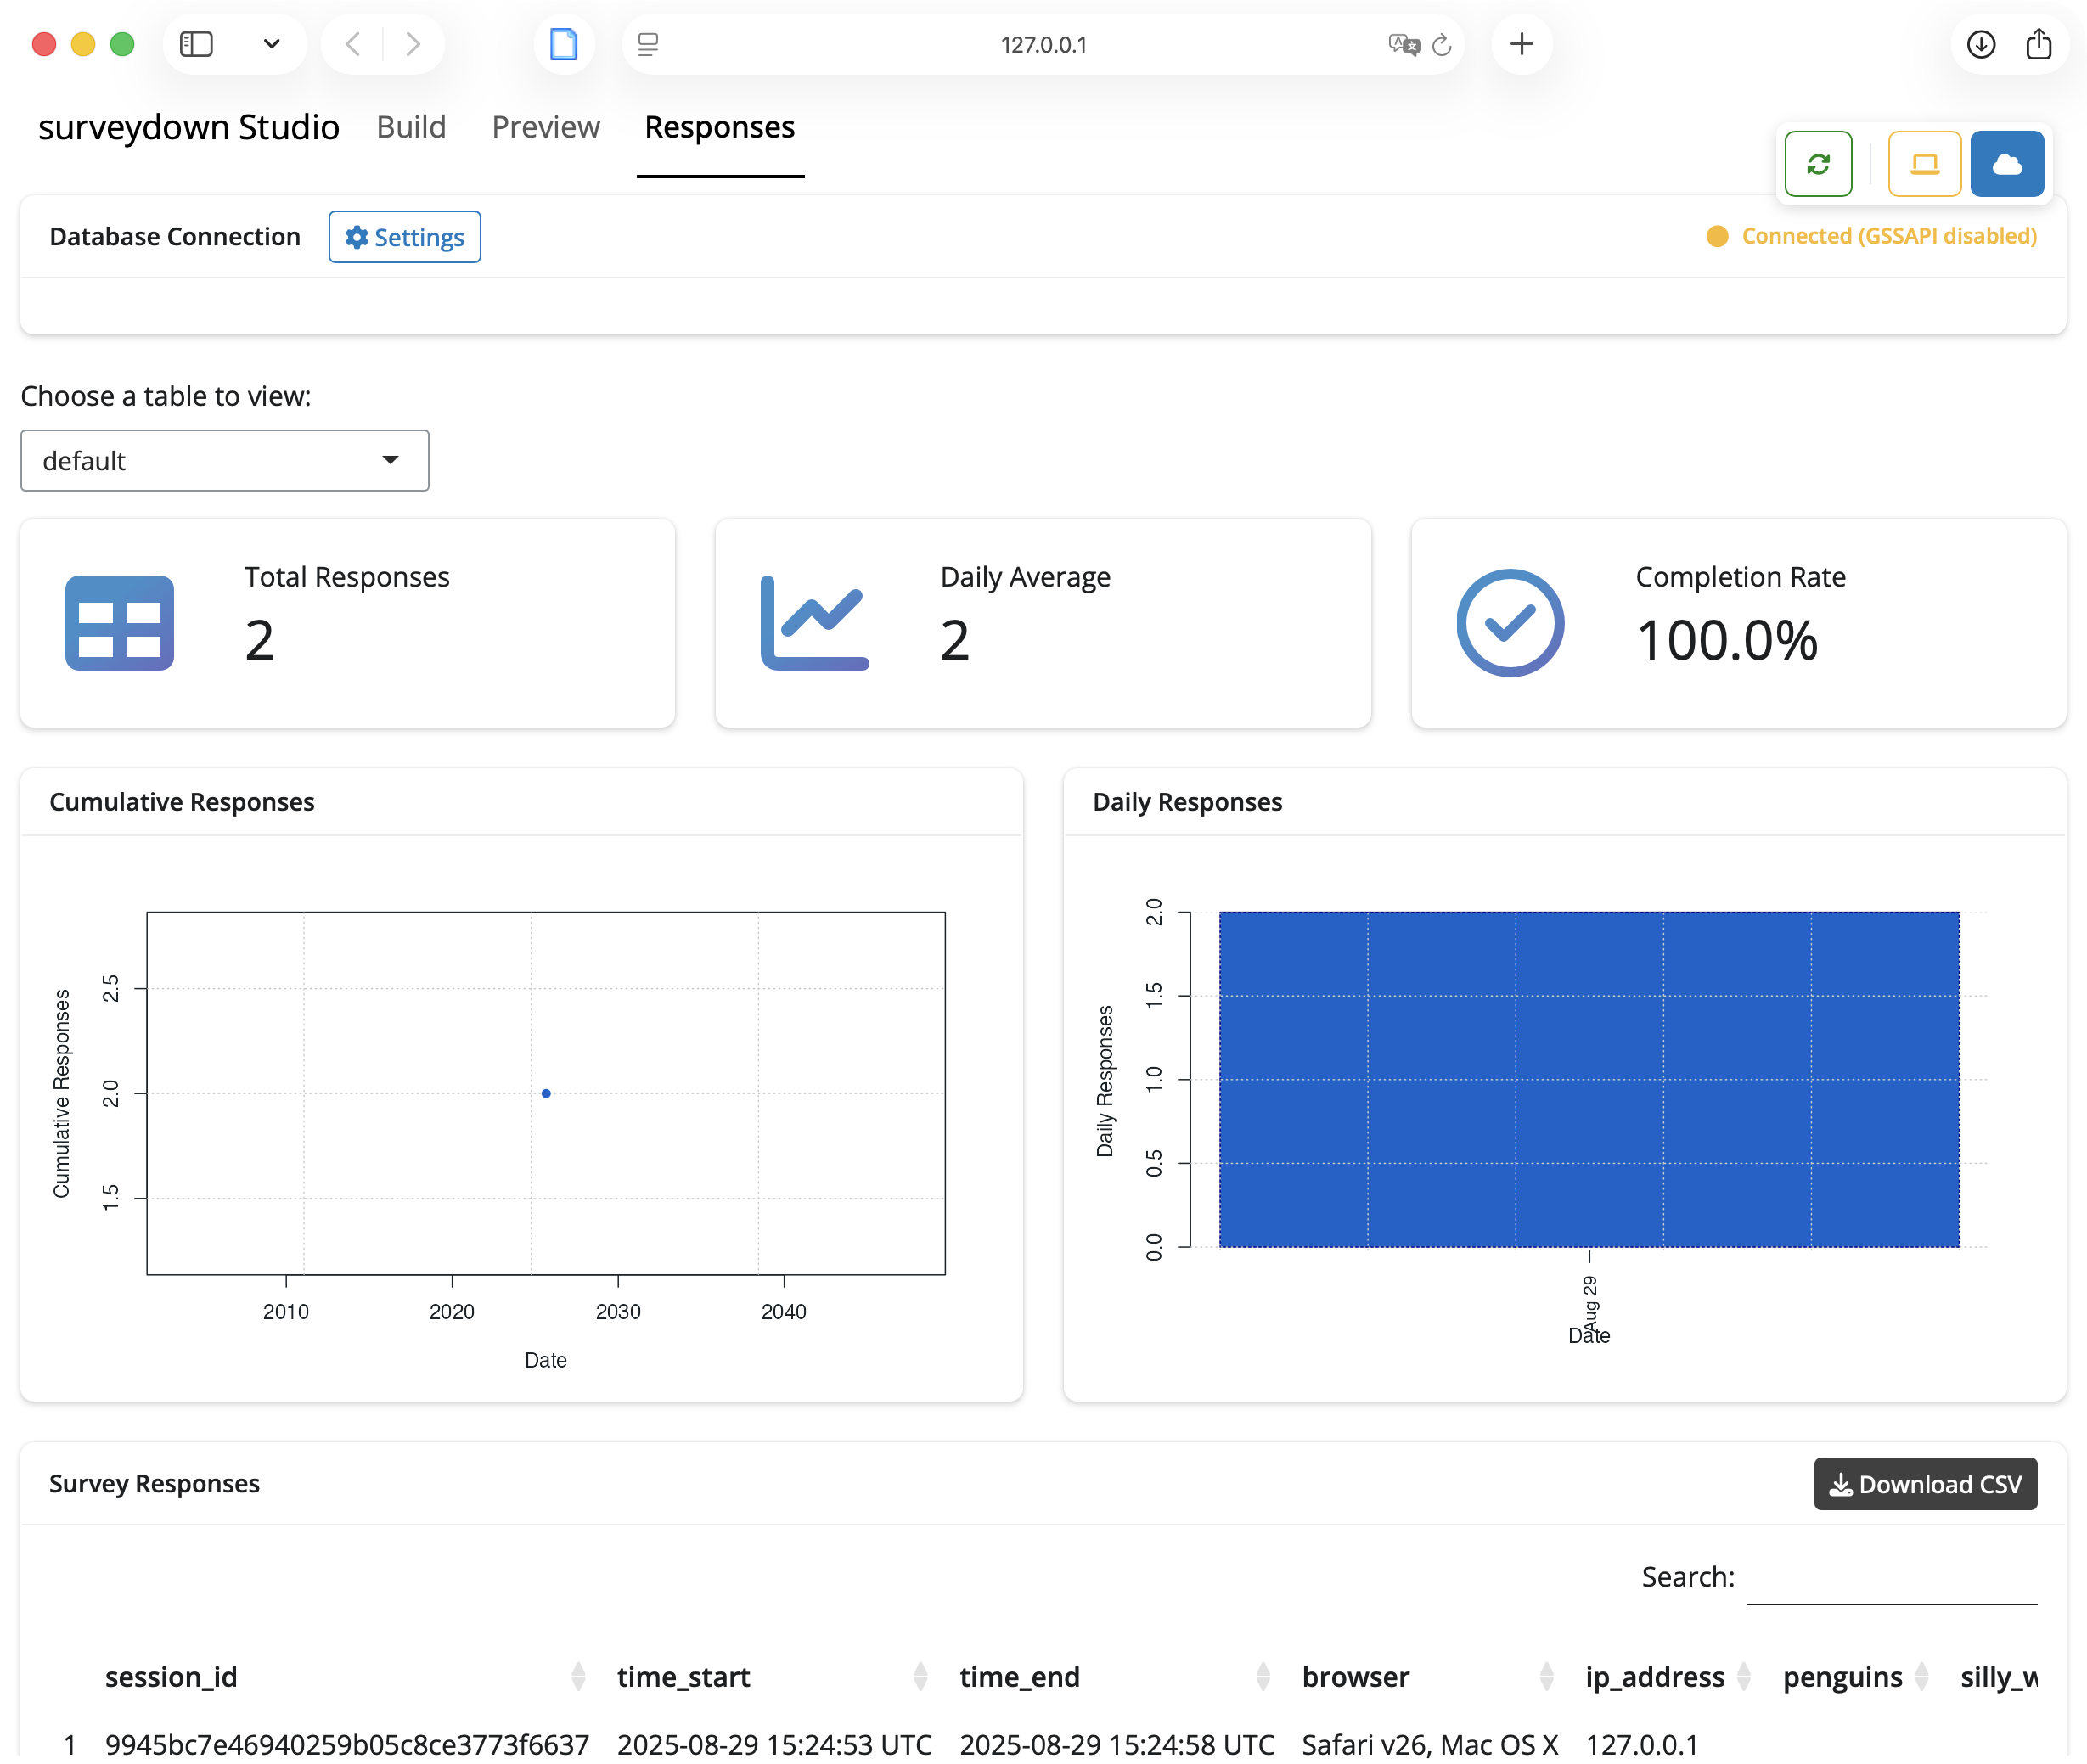
DB Mode
In this mode, a “Database Connection” card is provided on the top. You can toggle it on and off by clicking the “Settings” button next to the card name. Input your database credentials here and click “Connect”. You’ll see the connection status on the top right corner.
For more info on database connection, refer to the Storing Data page.
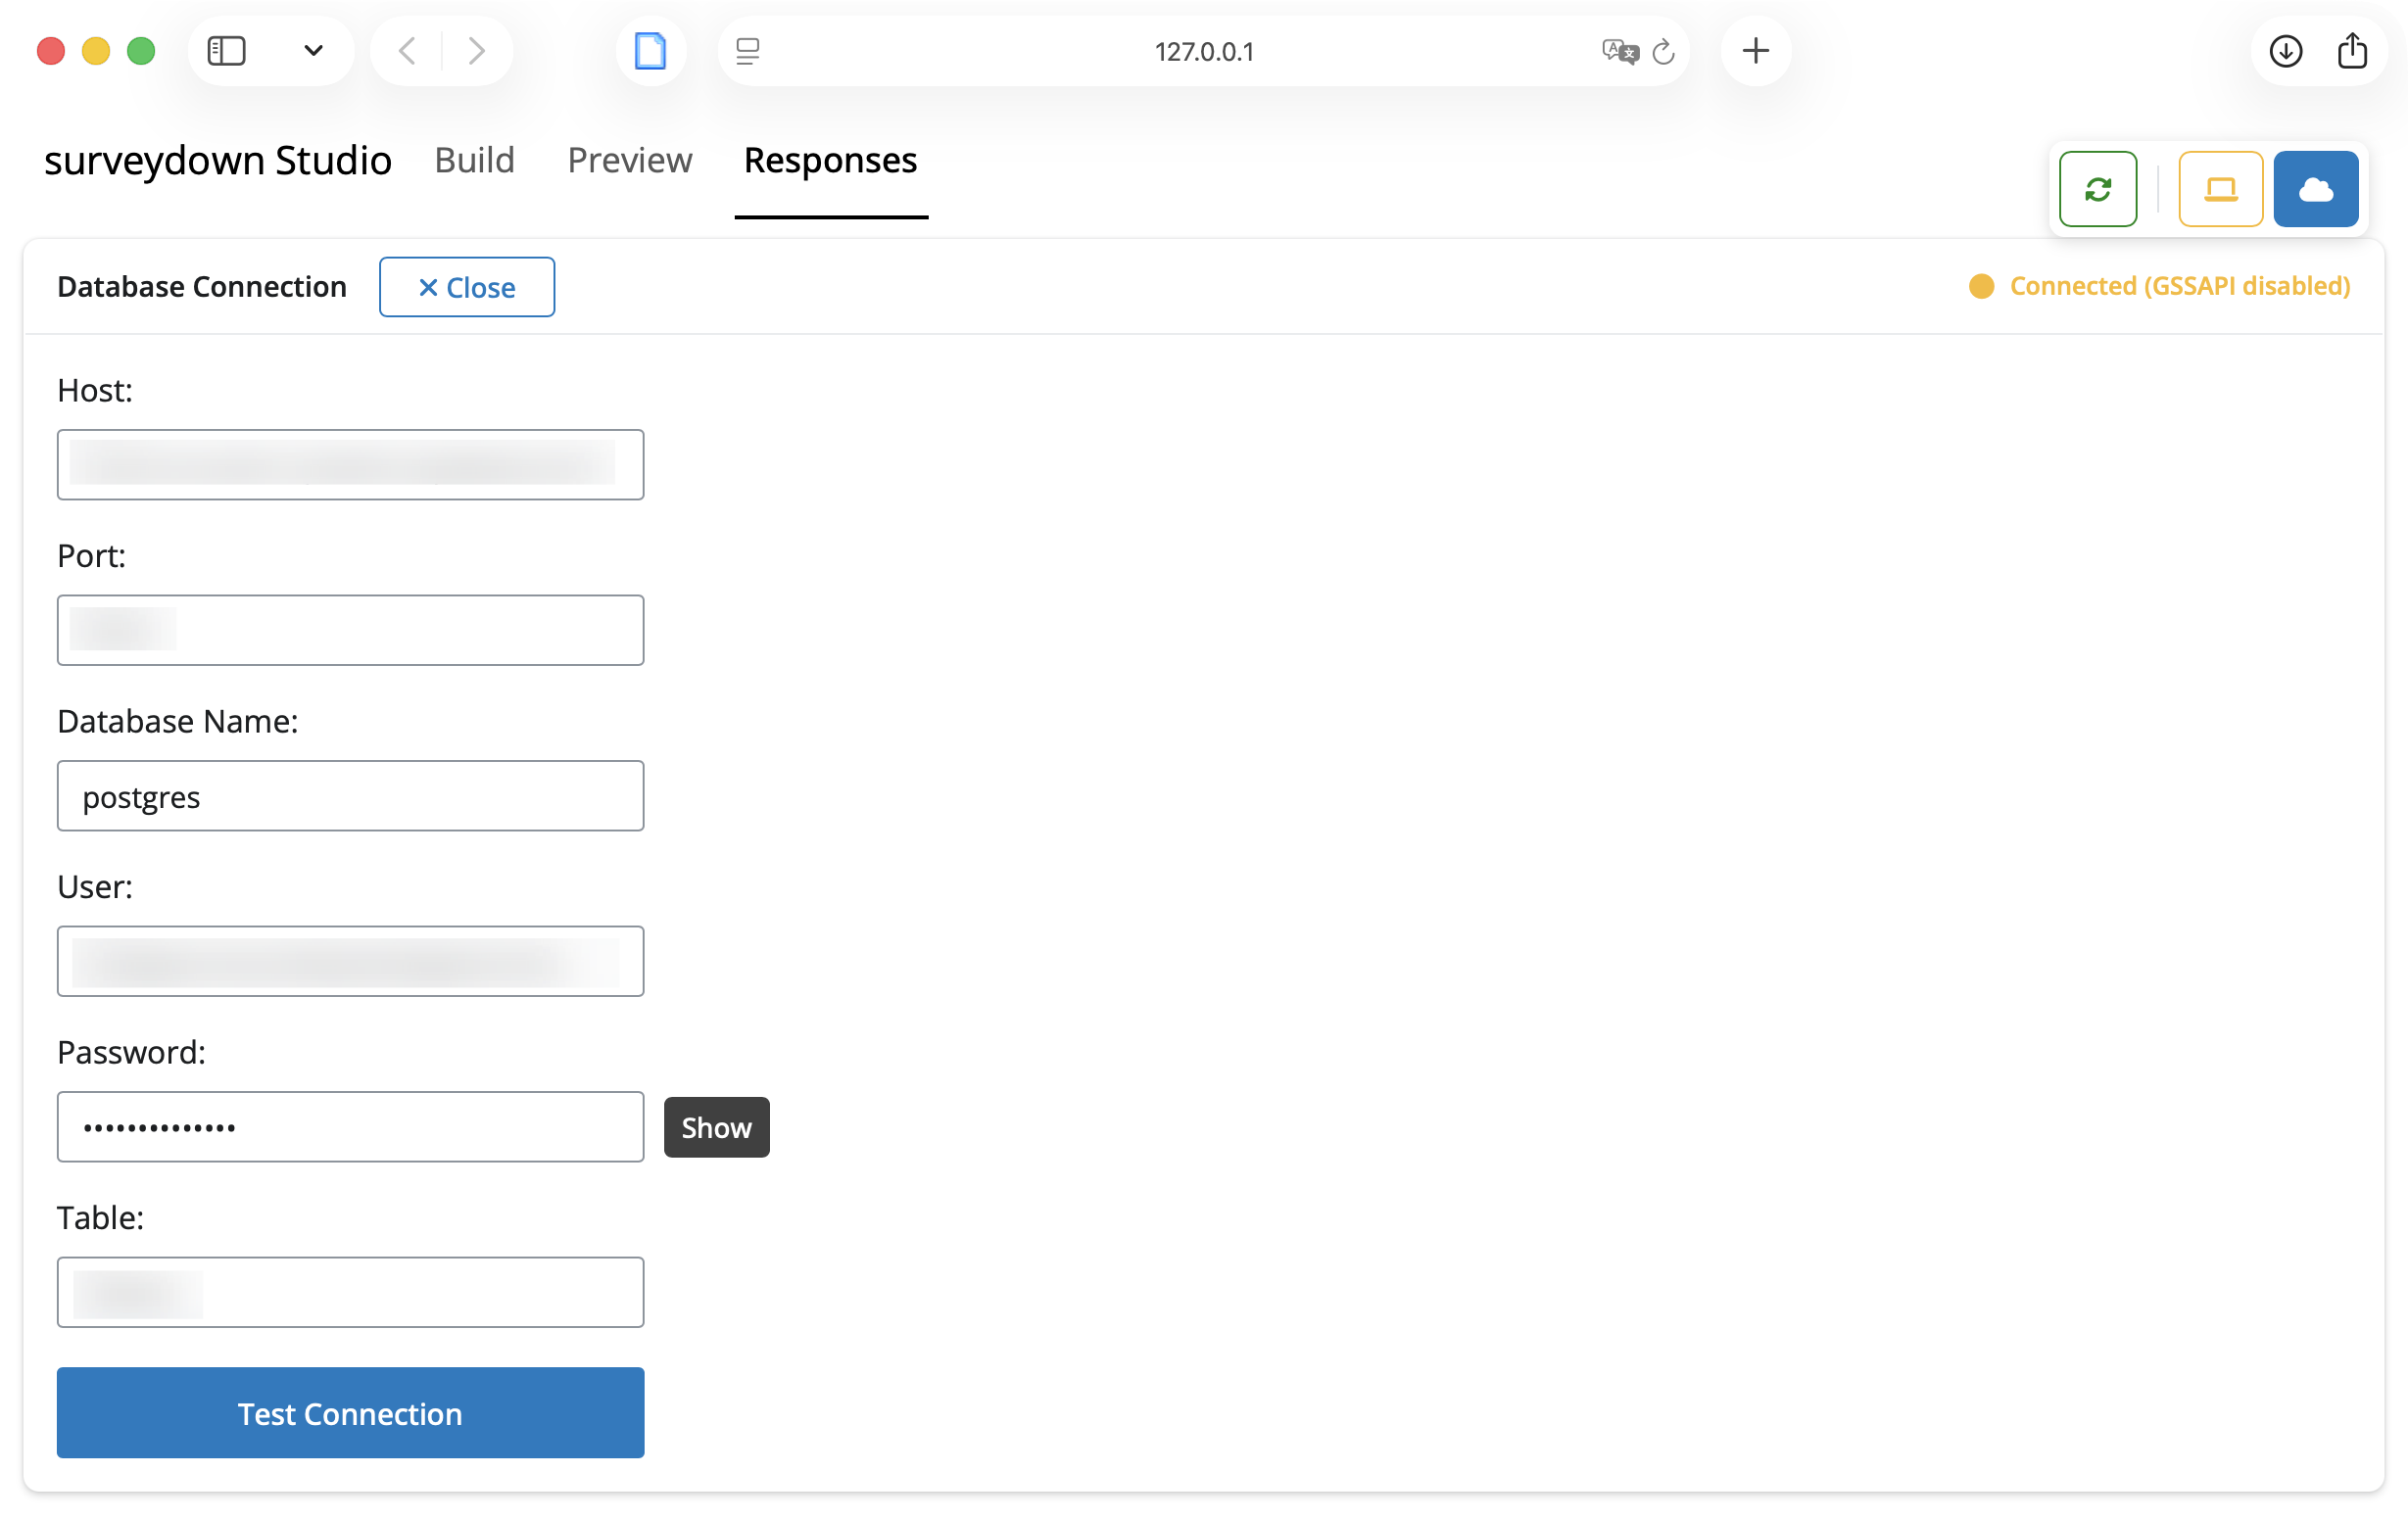
This is how the “Database Connection” card looks like when it’s expanded:
Tip
Therefore, you can either set up your credentials using the sd_db_config() function in your R console, or simply launch this studio app and modify them here.
When your connection is setup and ready, you can toggle the “Database Connection” card off and view your survey data. The layout is the same as the Local mode described above.
This is how the dashboard looks like in DB mode: