surveydown::sd_create_survey(
  #path = "path/to/survey",
  template = "live_polling"
)Live Polling
Reactivity
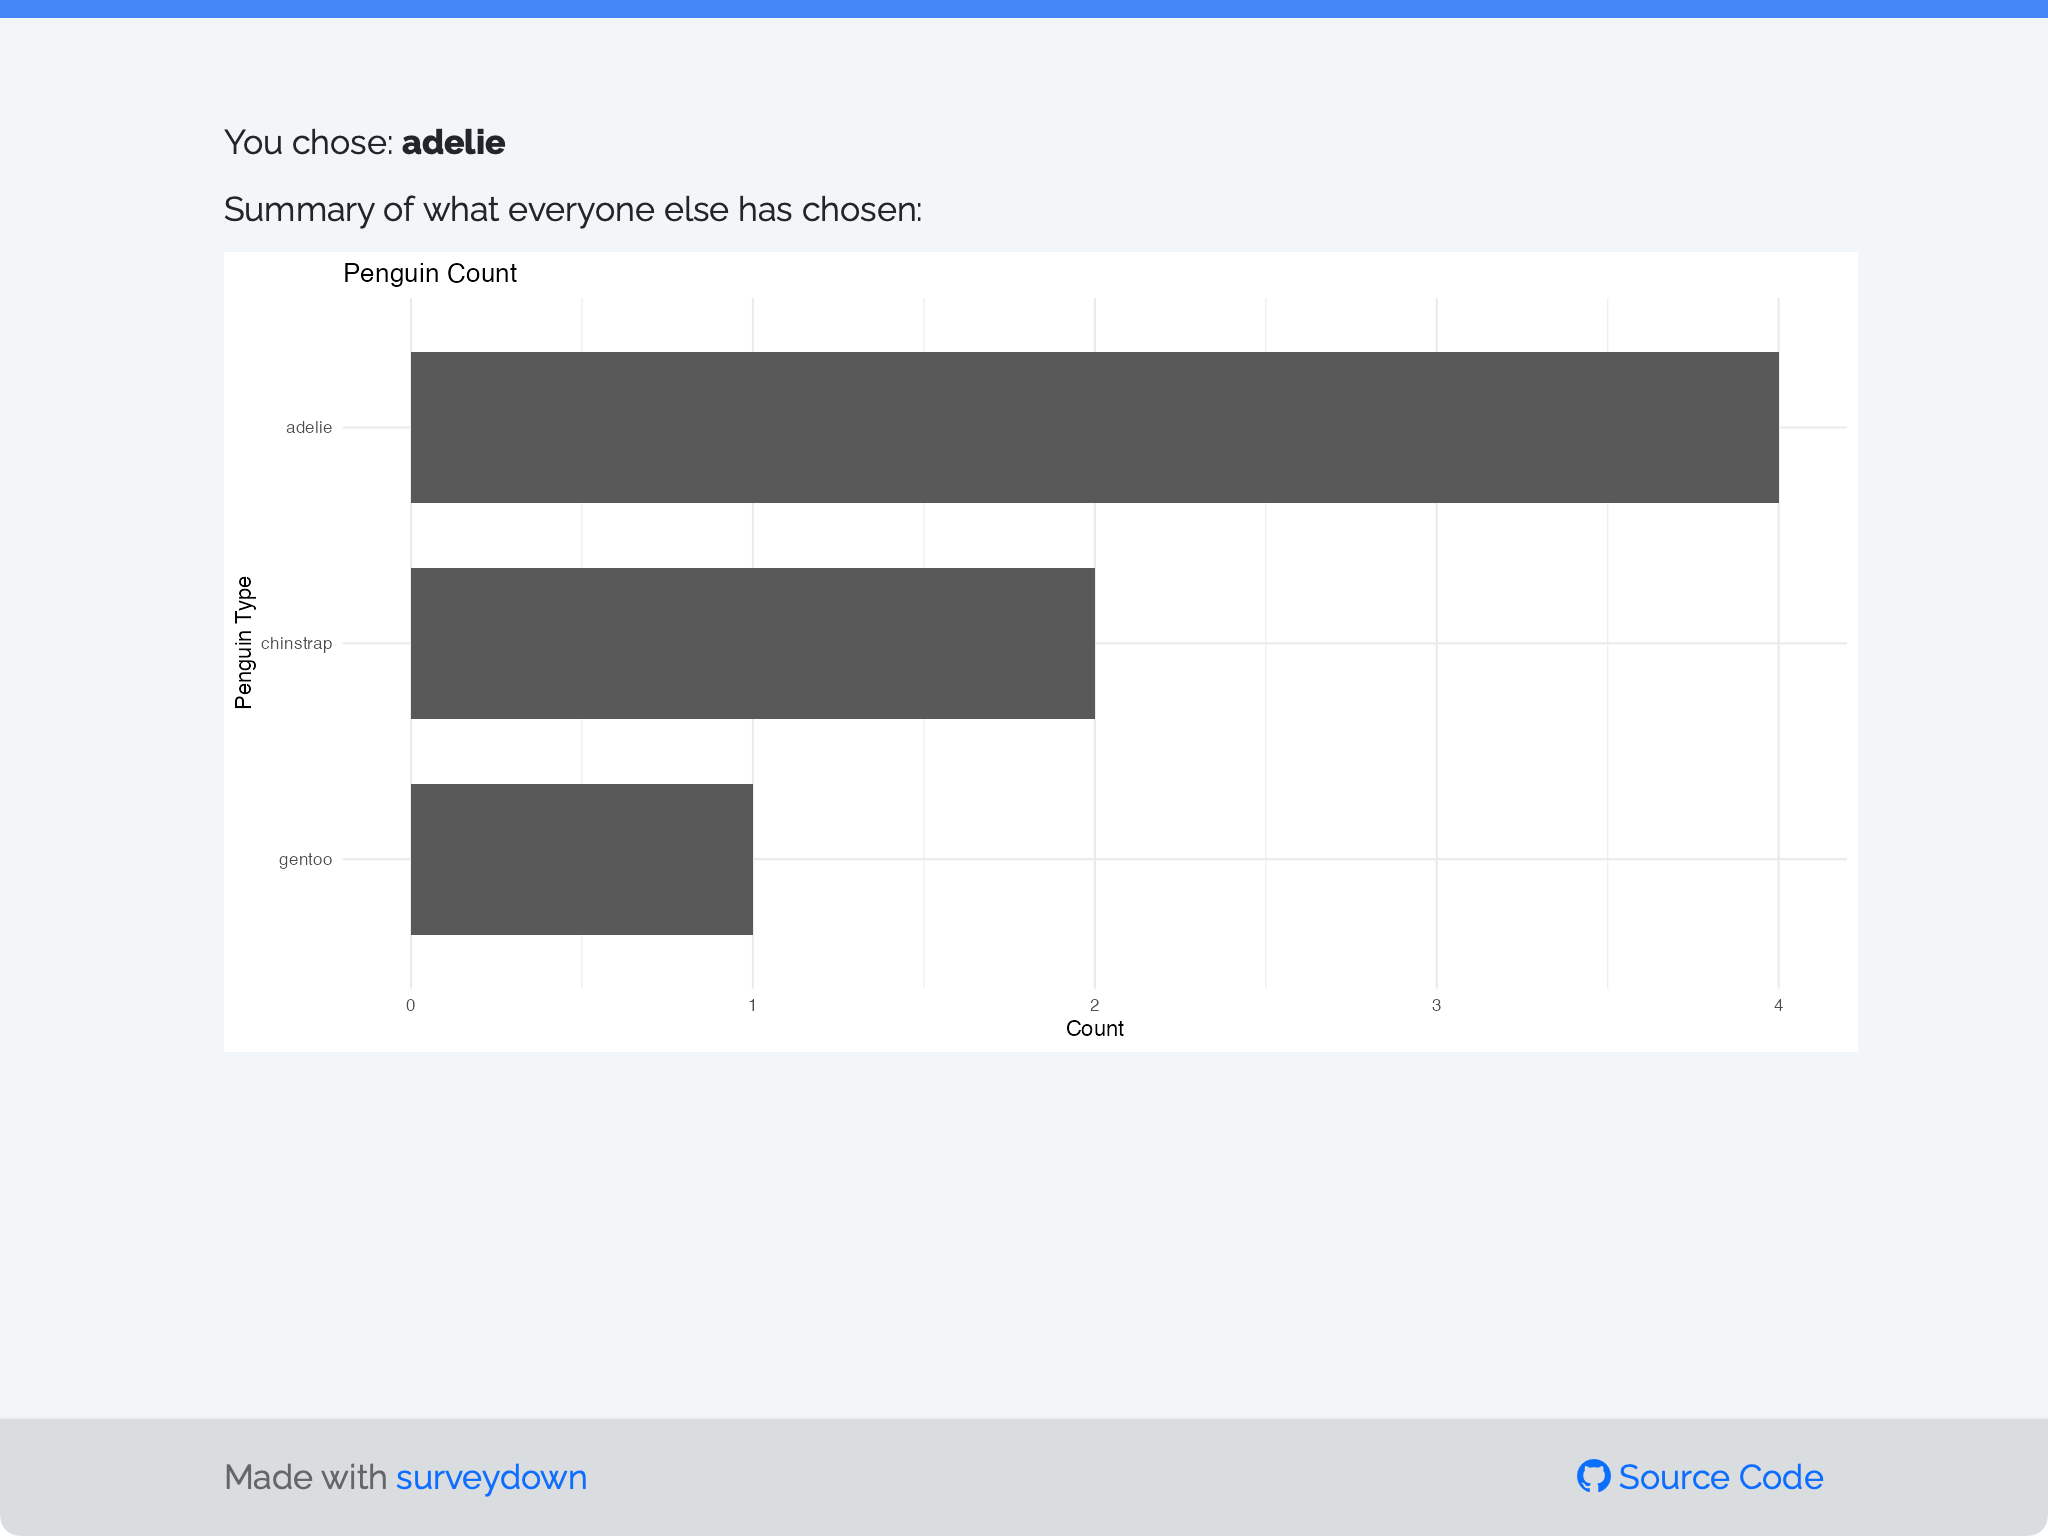
A reactive question template of live-polling with responses shown as a bar chart.
To create this template, run this command in your R console:
Refer to the Start with a template section for more details.
Note
- The live-polling feature requires connection to database and cannot be demonstrated in the template preview. Therefore, a screenshot of bar chart resulted by live-polling is shown here instead.
- To make this template work, you should firstly define your credentials by calling
sd_db_config(), and then delete theignore = TRUEargument in thesd_db_connect()function call. Once your survey is up and running, try to go through the survey several times. You’ll see the bar chart updating in real-time as new responses are submitted.

In the screenshot above, the survey page shows the choice of the current session, as well as a bar chart of all responses from the database. The bar chart updates in real-time as new responses are submitted. This feature is useful for live polling or feedback sessions where you want to see how opinions change over time.
Back to top